 .
. .
Comparison with other methods
.
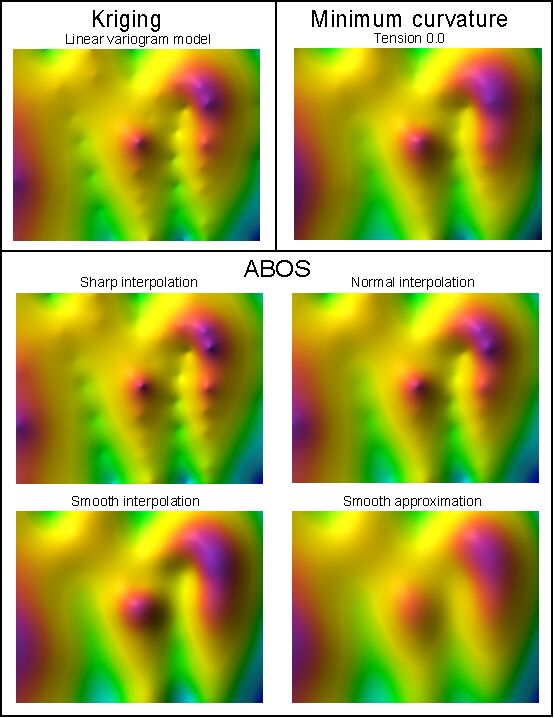
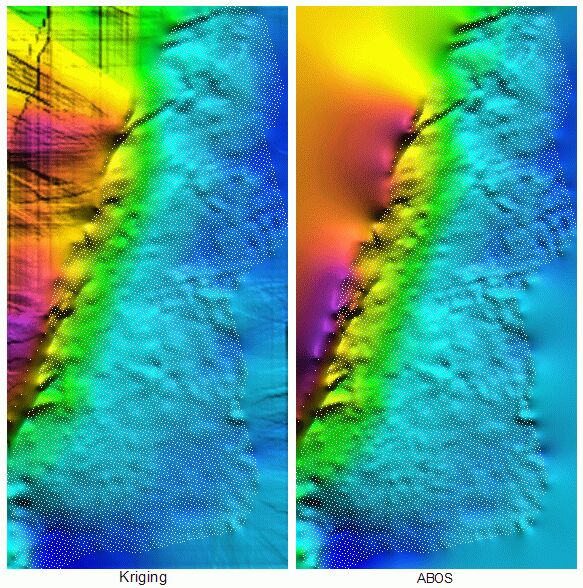
The program SurGe contains an interpolation / approximation method named ABOS (Approximation Based On Smoothing), which is described in User's manual. The quality of the resulting surface is affected by the parameters Smoothness and Accuracy. The effect of these parameters and the comparison with commonly used methods is illustrated in the next picture. It is obvious that ABOS can create surfaces comparable both to Kriging and Minimum Curvature methods.
Cross-sections through created surfaces provide another interesting comparison.
The mathematics of ABOS is very simple in comparison to the mathematics of commonly used interpolation / approximation methods, such as Kriging, Radial Basis Functions or Minimum Curvature methods. For example, the Kriging method needs to compute an experimental variogram, to fit the variogram model and to solve the system of linear equations. If the number of input points is large (say thousands), the number of linear equations is also large and cannot be solved in an acceptable time - in such case, additional parameters influencing the quality of the resulting surface must be specified - search radius, number of search sectors, maximal number of points in each sector and so on.
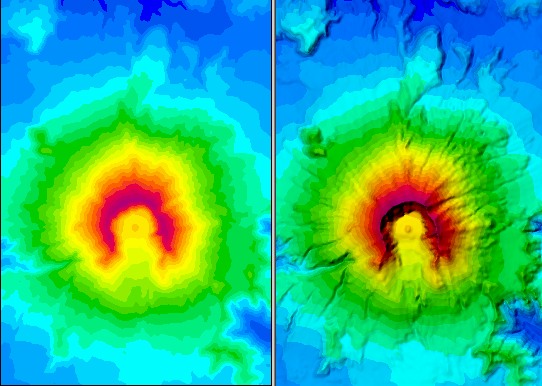
The mathematical complexity is related to the computational time
- Kriging needs for example 115 seconds for interpolating
9500 points into a grid of 200x400 nodes, while ABOS needs 10
seconds (time was, of course, measured on the same computer).
The result of both interpolations is shown in the next picture.
While the surface in regions with no data is smooth in the ABOS
case, Kriging created, in these regions, strange
jumps resulting from the search algorithm. The Radial
Basis Functions method has the same problem.
06.11.2020
- fix of SurView scale bug.
- new algorithm of isolines display. Labels of marked isolines are
more readable and distinct even if strong zoom is used.
30.07.2017
- 64bit version of SURGEF was also adapted so that it utilizes
multiple processor cores / threads. The 64bit version is about 20%
faster than 32bit version and can be downloaded here: SurGeF64.zip
27.10.2017
- New compilation of SURGEF using GNU FORTRAN 7.1.0. The source
code was adapted in order to utilize multiple processor cores /
threads. Now the interpolation process is three times faster in
average and can be downloaded here: SurGeF32.zip.
02.10.2012
- There is a possibility to display alternative coordinates using
so called georeferencing technique - see here.
27.09.2012
- SurGe was successfully tested in Linux (Ubuntu) using WINE - see
here, how to install it.
17.09.2012
- SURGEF now reads an external grid (see How to utilize an existing grid
in the SurGe Tutorial) in ASCII format (see here) compatible with
SURFER (Golden Software) - if the binary file NAMEf.GRs
containing an external grid is not found, SURGEF searches for the
file in ASCII format NAME.GRs and
reads it, if the file exists.
15.12.2011
- fix of insignificant bug in SURGEF.
- SurView now enables to display axes and to measure horizontal
distance. Display of labels and z-coordinates was enhanced.
- map can be moved or zoomed using the mouse in both modes of
SurGe (move/zoom mode and digitization mode):
- While Ctrl
key is pressed, the map is moved according to the mouse cursor
movement.
- While Shift
key is pressed, the map is zoomed as the mouse cursor is moving
from the left to the right.
- Mouse wheel can also be used for zooming
22.04.2011
- bug fixed in the boundary created as a convex envelope - memory
allocation of auxiliary array was insufficient.
20.04.2011
- SurView now enables to display points position and point labels
or z-coordinates. Note that the maximal number of displayed points
is 10000 - the rest is ignored.
18.04.2011
- Microsoft removed hardware acceleration of the most GDI
(Graphics Device Interface) functions in Windows 7. As a
result, the GDI (responsible for tasks such as drawing lines,
polygons and so on) is five times slower in comparison with
Windows XP. That is why I was forced to implement so called double
buffering in SurGe display, which utilizes BitBlt function for
fast display of graphics. BitBlt is one of a few GDI functions
remaining hardware accelerated in Windows 7.
16.04.2011
- programmer's nightmare:
64-bit version of SURGEF crashed on certain data set. It was
caused by standard C function realloc, which behaves
differently in the 32 and 64-bit version.
The bug was fixed - please download the corrected version of SurGeF64.zip.
05.04.2011
- 64-bit version of SURGEF interpolation engine (SurGeF64.zip) is now available for
64-bit Windows operating systems. It is about 20% faster than
32-bit version.
11.03.2010
- bug fixed in computation of polyline points
- bug fixed in printed isoline labels
14.12.2009
- most dialogs now contain context-sensitive help.
20.11.2009
- bug fixed in isoline computation and isoline digitization.
03.09.2009
- GRIDCONV.EXE utility is utilized for importing some of common
grid formats (see How to import
other map/GIS grid formats in SurGe Tutorial).
- GRIDCONV.EXE utility now replaces DEMGRD.EXE, ARCGRD.EXE and
GRSGRD.EXE (see Conversion command
line utilities).
12.08.2009
- new main menu in SurView
25.07.2009
- new in SurView:
- selection of color palette
- display of color scale
20.07.2009
- several new color palettes was created: Globe.pal, Polar.pal,
Steel.pal and Topo.pal
- editor of color palette for raster maps and 3D view (see Color palette in User's Manual)
10.12.2008
- version 6.50 released
06.12.2008
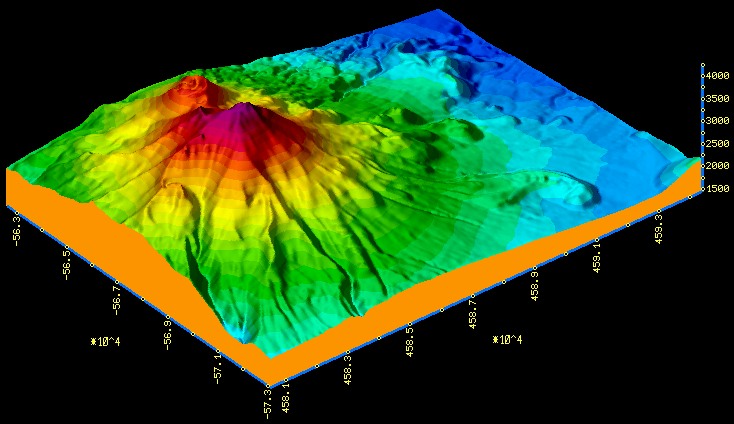
- new 3D OpenGL surface viewer SurView
was created as a stand alone utility, suitable namely for
displaying of the large broken grids. Main features are:
- display of shadowed surface with optional change of light
height position and light intensity
- move, zoom, rotation and z-scaling using shortcut keys or
by mouse dragging
- parallel (orthogonal) or perspective projection
- switch between color + shadow / only shadow / only
color display modes
- switch between wireframe and filled surface
01.11.2008
- change of my ordinary mail address - see Main page
04.06.2008
- SURGEF.EXE was compiled with GNU Fortran v. 4.4.0. Now it is
about 7% faster.
11.02.2008
- output of isolines as ASCII file (see the menu item Output
/ Isolines as ASCII file) now contains 11 decimal places.
04.11.2007
- error in isoline computation corrected.
- better diagnostics in input data procedures.
26.06.2007
- bug fixed in internal filter.
25.05.2007
- Gallery
of surfaces created and displayed by SurGe was added to web pages.
22.05.2007
- SurGe documentation now contains animated GIF showing
interpolation process. See User's
Manual.
20.05.2007
- transmission of grid size between SurGe Project Manager and
SurGe was not correct.
23.02.2007
- Linux users may try to use SURGEF interpolation engine as a
console application (see Main Page.).
19.02.2007
- number of input points is limited only by available computer
memory. SurGe was successfully tested with 5000000 points.
- new algorithm of internal filter - now it is about 7 times
faster (5000000 points are filtered within 5-15 seconds).
- reading of input data is more than two times faster thanks to
the new routine ATOFL for reading real numbers in ASCII format.
07.11.2006
- version 6.30 released
05.11.2006
- cosmetic enhancement of the cross-section display.
04.11.2006
- new sections in the SurGe Tutorial: How to simulate wedging out of
layers and Maps of
thickness and volume calculation.
03.11.2006
- new section in the SurGe Tutorial: How to directly convert seismic
reflection times to structure depth.
29.09.2006
- running of new SurGe instance with selected map detail - see
section Detail of map in
the SurGe User's Manual.
27.09.2006
- text specification in the background mode. See section Background in the SurGe
User's Manual.
21.09.2006
- derivative of surface can be computed as the size of gradient
vector - see Math calculation with
grid.
19.09.2006
- using of SURGEF in applications was extended. Follow this link for more information.
30.08.2006
- interpolation with trend surface was extended. See Interpolation with trend surface
in the User's Manual.
12.05.2006
- all points XYZ now may have the same z-coordinates.
10.05.2006
- bug fixed in gradient lines computation
04.04.2006
- display of shadowed relief (shortcut key Alt+Q) is three
times faster.
29.03.2006
- output of grid in the ArcGIS format - see the menu item Output
/ Grid as ArcGIS file.
- new command line utility ARCGRD supporting import of grid in
ArcGIS format.
- supported map formats are listed in the new section in Support for other map formats.
28.03.2006
- cosmetic enhancements of 3D view display and print.
20.03.2006
- bug fixed in DEMGRD utility.
15.03.2006
- version 6.10 released
11.03.2006
- iteration process in SURGEF.EXE can be stopped by Esc
key. In this case the actual iteration step will be completed
before the stop.
09.03.2006
- new algorithm of internal filter - now it is about 10 times
faster.
- maximal number of input points was increased from 100000 to
300000.
05.03.2006
- SURGEF.EXE now uses dynamical allocation of memory in spite of
the fact, it is compiled by FORTRAN 77. Grid size is limited only
by available memory.
17.02.2006
- a view point in the 3DVIEW mode can be changed by mouse
movement, if the left button is pressed.
13.02.2006
- SurGe now automates the interpolation based on a trend surface.
This feature improves extrapolation properties of resulting
surface in areas not containing points XYZ (compare the two
pictures below). Details are in the section Interpolation with trend surface
in the User's Manual and in the SurGe Tutorial in
sections How to obtain trend
surface and How to
utilize trend surface for improving extrapolation.
This new function is under the Interpolation menu.
11.02.2006
- new item under the Interpolation menu was added - see
the section Data analysis
in the User's Manual.
01.02.2006
- information about upper Filter limit in the
documentation is obsolete and was corrected to 9999. Special
value 0 means that only the points having the same x and y
coordinates will be filtered.
25.01.2006
- name of GRASS output files was corrected - see the User's Manual.
19.01.2006
- boundary in the digitization mode can be created as a convex
envelope of XYZ points. See the section about Boundary in User's Manual.
Practical usage of convex envelope is described in the section How to modify the size and the shape
of the grid area in the SurGe Tutorial.
12.01.2006
- SURGEF.EXE enables to create a boundary as a convex envelope of
XYZ points. See Using SURGEF in
applications.
05.01.2006
- new dialog Scaling and translation (see the menu item Transformation)
enables to multiply and/or translate any combination of
coordinates. It is recommended to save transformed coordinates
(use the menu item Save objects) and to perform new
interpolation, because after any transformation of coordinates the
surface does not correspond to changed data.
12.12.2005
- version 5.90 released
08.12.2005
- a click on mouse right button in move/zoom mode now enables
to select the way, how to perform interpolation. For details see SurGe Tutorial.
01.12.2005
- dialog box Interpolation parameters now contains the
list of pre-defined parameters suitable for desired type of
interpolation / approximation. For details see SurGe Tutorial.
25.11.2005
- new interpolation mode (LES interpolation) suppresses an
exceeding of local extreme values. It is suitable for zero based
maps.
16.09.2005
- correction of wrong boundary display in case of extremely great
enlargement of map.
04.09.2005
- command line utilities supporting import of DEM, GRASS and
Shapefile data formats can be now downloaded as a separate file.
Details are in SurGe conversion
utilities.
03.08.2005
- the maximal length of point labels was increased from 10 to 23.
02.08.2005
- in the digitization mode it is now possible to measure
horizontal distance. See How to
measure horizontal distances in the Surge Tutorial.
28.07.2005
- computation of cross-section was improved and the error message
Too small distance between cross-section points was
removed, because now there is no reason for it. Maximal number of
cross-section points was increased from 99 to 333.
13.05.2005
- minor bug in FMEW fixed.
29.04.2005
- installation program now detects, if your CPU supports MMX and
SSE2 instructions (for example Pentium 4, Pentium Centrino, Xeon,
...). If yes, the program installs SURGEF.EXE utilizing these
instructions. Then the interpolation is about 25% faster.
28.04.2005
- section Using SURGEF in
applications in User's Manual was updated.
21.04.2005
- computation of the matrix NB
is now more than three times faster for surfaces with
faults.
20.04.2005
- computation of DZ values
near faults was corrected. This problem caused bad convergence if
there were points XYZ too near to faults.
15.04.2005
- section Output in User's
Manual was updated.
10.04.2005
- new shadowed display mode in 3D view:
Shortcut key E displays the surface with pure colors and clears all shadows.
Shortcut key Alt+Q adds shadows with specified angle and intensity. It can be used several times with different angles and intensities (see the next picture).
Shortcut key W displays the surface with actual setting of shadows (after rotation, zoom, ...).
09.04.2005
- error in faults definition is now described in the User's Manual.
03.04.2005
- new section in the User's
Manual describing a possibility to call SURGEF.EXE
from user applications.
25.03.2005
- filter built in the program SURGEF is now more than two times
faster. For example, 30000 points can be filtered within 5
seconds.
18.03.2005
- shadowed relief display (shortcut key Alt+Q) improves a
3D feel of raster color map - compare the next two pictures.
04.03.2005
- points (and labels and / or z-coordinates, if they are
displayed) can be displayed (using the shortcut key Alt+S)
in colors indicating their z-values. See the next picture:
This function is enabled only if raster color map or isolines are not displayed.
03.03.2005
- the speed of interpolation algorithm has increased by cca 25%.
24.02.2005
- SurGe Tutorial was extended - see new chapter Print.
23.02.2005
- cross-section display was enhanced and bug in the description of
layers was fixed.
21.02.2005
- two Excel macros were created for Excel users. The first one
enables to write selected block of data into ASCII file, the
second one creates auxiliary file #EXCL#.DTA and runs SurGe on
this file. See SurGe and Excel
in documentation.
- SurGe now exits properly, if one of input files has wrong
format.
17.02.2005
- new shortcut key Ctrl+E enables to display a mesh and
labels, while previously implemented shortcut key Ctrl+S displays
only a mesh. Ctrl+E also displays axes, if there is enough
space on the left or/and bottom side of the map. If there is not
enough space, use arrow keys for moving of the map. See menu item
Display / Mesh labels.
09.02.2005
- version 5.70 released
08.02.2005
- shortcut key Ctrl+F3 enables quick creation and preview
of map
- if 0 0 (zero space zero) is typed as a response to SURGEF prompt
SMOOTHING [ 16]: 0 0 then only per
partes constant interpolation is performed
29.01.2005
- implementation of new tensioning algorithm (see the User's Manual for details).
- interpolation process is two times faster in
average (the speed was tested on data sets provided by SurGe
users):
- linear tensioning has four degrees (0-3).
The level 3 corresponds to the level 2 in the previous version.
- shape of generated surface near to faults is
apparently better.
- estimation of number of smoothing and tensioning repetitions was
enhanced and default values ensure good quality of generated
surface outside the convex envelope of points XYZ.
28.12.2004
- the estimation of grid size in SURGEF.EXE was improved.
21.12.2004
- algorithm of Faster convergence was improved.
14.12.2004
- in the working directory there can be two new files for common
definition of color / isoline levels, NAME.CL
and NAME.LV.
See the User's Manual for
details.
- fixed problem with color scale, if values out of boundary are
blanked.
10.10.2004
- fixed problem with mouse cursor in the move/zoom mode.
- SURGEF.EXE now computes average deviation 1/NB*åabs(DZi)
at each iteration step and displays overall time of interpolation.
22.09.2004
- new menu item Output / Z-values at points was
added. It reads X and Y
coordinates from the specified input ASCII file, computes
corresponding Z value and writes the result (X,
Y and Z values) into specified
output file. The input file must contain X and Y
coordinates in the first two items of each row. The rest of
row is copied into output file.
The format of the input file rows must be:
X Y [any-text]
The format of the output file rows is:
X Y Z [any-text]
20.09.2004
- fixed problem with installation directory, if the name of the
directory contains spaces.
20.07.2004
- SurGe Project Manager did not work on some computers
with Windows95 and Windows98. The problem was fixed.
14.07.2004
- SurGe Project Manager now enables to create copy of
actual subproject or actual map.
- fixed problem with mouse cursor blinking in the move/zoom mode.
01.07.2004
- the background is printed, if it was displayed
- fixed problem with blinking display, if the "Show window
contents while dragging" is switched on (see the system
setting of "Effects" in the desktop "Properties").
23.06.2004
- the raster color map is printed, if it was displayed
21.06.2004
- the axes in the printed map can be switched on / off - see the
dialog box for map printing.
- bug fixed in the initial setting of the mesh scale.
11.06.2004
- version 5.50 released
08.06.2004
- Surge Project Manager was extended. Now it contains pre-defined
grid size and buttons for editing color map levels and isoline
levels.
If the grid size in the X direction is zero, SURGEF.EXE suggests
appropriate value.
If the grid size in the X direction is positive and the grid size
in the Y direction is zero, SURGEF.EXE accepts the first value and
suggests appropriate second value.
If both values are positive, SURGEF.EXE accepts them.
08.06.2004
- new level of linear tensioning was involved into SURGEF.EXE. Now
there are three levels of linear tensioning:
0 ... no linear tensioning - corresponds to the "Linear
interpolation" switched off in the previous version
1 ... medium linear tensioning - corresponds to the "Linear
interpolation" switched on in the previous version
2 ... strong linear tensioning - new level of linear tensioning.
If the second level is used with the small number of smoothing
(say from 1 to 5), the SurGe can be used for so called digital
model of terrain - as an example see the digital model of a stone
quarry in the next picture.
07.06.2004
- update of User's Manual
20.05.2004
- update of User's Manual
15.05.2004
- sharp/smooth model at local extremes was improved by extending
of the smoothing parameter. Now the smoothing parameter can have
two formats:
1) number 0.00 - 9.99, which is equivalent to the original
smoothing parameter
2) number 100.00 - 999.99, where the first two digits
divided by 10 determine so called shape factor, which has
influence on the shape of surface in the surrounding of sharp
local extremes. The smallest value 1.0 means, the shape will not
be changed and any greater value (1.1-9.9) means, the local
extreme will be sharper. The remaining digits have the original
meaning.
Example: extended smoothing parameter 300.5 means, the
original smoothing parameter is 0.5 and the shape factor is 3.0.
The cross-section plot illustrates the effect of such shape factor
- the gray curve corresponds to the shape factor 1.0 and the green
one corresponds to the shape factor 3.0.
Remark: If the smoothing parameter has the first format, the shape factor has default value 1.0.
05.04.2004
- cosmetic improvement of 3D display.
31.03.2004
- error in compilation of the FMEW.EXE - wrong compiler switches
were used. Sorry for this failure. Now FMEW runs OK.
21.03.2004
- as a response to request of many users, project levels in the SurGe
Project
Manager was extended from 2 to 3 - see the documentation
for SurGe Project Manager.
17.03.2004
- GFILTR was rewritten as a dialog-based windows application (see
description in the Tutorial)
and integrated into SPM.
14.03.2004
- version 5.00 released
12.03.2004
- SurGe now uses free installer for Windows programs "Inno
Setup". The installation is quite easy now.
11.03.2004
- the first version of SurGe Project
Manager (SPM) was released. SPM enables to manage
projects and maps, to run SurGe for selected maps, to edit data of
map objects (using stand-alone editor FMEW
or using any ASCII editor selected by the user), to calculate
volumes between two surfaces (using stand-alone program VOLUME) and much more. SPM and FMEW
has some limitations for
unregistered users.
26.02.2004
- in most cases the number of iterations can be now decreased by
the transformation Pnew = A*Pold+B,
where P is smoothed matrix (see
User's Manual) and
constants A and B
minimize the term å(A*f(Xi,Yi)+B
-
Zi)2. The
resulting surface is somewhat smoother, but the number of
iterations is decreased by cca 30%. See new check button Faster
convergence in the dialog box Interpolation parameters
under the menu Interpolation.
- new dialog box Point and label display setting under Display
menu. Replaces menu items under Display / Font size
and enables to set all display combinations, which are also
available by keys Ctr1+1, ... ,Ctr+4 (font size setting),
Ctrl+Alt+L (hide/display labels and/or z-coordinates), Ctrl+Alt+P
(display of points) and Ctrl+Alt+T (display of added
points).
25.02.2004
- new dialog box Objects for interpolation in the menu Interpolation.
Replaces checked menu items in the menu File.
24.02.2004
- display of points can be changed using shortcut key Ctrl+Alt+P
and display of added points using shortcut key Ctrl+Alt+T.
These keys switch between modes:
- hide all points
- display points as pixels
- display points as small rectangles
- display of point labels and/or z-coordinates in map and 3D view
can be changed using shortcut key Ctrl+Alt+L. This key
switches between:
- hide all labels and/or z-coordinates
- display only point labels and/or
z-coordinates
- display only added point labels and/or
z-coordinates
- display all point labels and/or
z-coordinates.
13.02.2004
- bug fixed in 3D display of labels, if the grid is doubled
- correction of 3D view, if the surface is approximative
11.02.2004
- version 4.30 released
10.02.2004
- levels of raster color map can be specified in the ASCII file NAME.CLs,
where s is a suffix (see User's Manual for
details).
29.01.2004
- SURGEF now suggests "reasonable" dimensions for grid.
22.01.2004
- shortcut keys F2,...,F9 were added into menu item Interpolation.
13.01.2004
- bug fixed in the smoothing of the existing grid, if the
grid is read from a file
09.01.2004
- isoline levels can be specified in the ASCII file NAME.LVs,
where s is a suffix (see User's Manual for details).
- bug fixed in isolines calculation
05.01.2004
- correction of color map display, if the function "Substitute
below" or "Substitute above" is applied
- calculation of the difference vector has been corrected to
obtain better information about convergence in case of data with
great difference of z-values at very near points.
19.12.2003
- change of e-mail address: M.Dressler@centrum.cz
14.12.2003
- possibility to change font size using shortcut keys Ctrl+1,
... , Ctrl+4 (see new item in the Display menu)
09.12.2003
- bug fixed in formatting of the ASCII grid file
- warning message about no existing grid file at start of program
was suppressed
- installation did not contain the file SURGEF.EXE as referenced
in documentation, but an identical file with a different name -
3DGRAFF.EXE. Thanks to Avijit Chowdhury for warning! The
problem is now corrected in the new installation package.
08.12.2003
- flexible formatting in some dialogs
- flexible formatting of records in output ASCII files
05.12.2003
- bug fixed in color scale
03.12.2003
- color scale enhanced
- correction of axes description in 3D view
01.12.2003
- new SurGe presentation at WEB page http://www.digitalgrove.net/Toolbox_mappers.htm.
(Thanks to Paul Pingrey!)
10.11.2003
- version 4.20 released
- extension of documentation
- correction of minor bugs
10.03.2003
- the first publication of SurGe on the Internet
- version 4.10 released